
Geofencing advertising delivers a mobile ad, push notification, or in-app message the moment a device crosses a virtual boundary you draw around a physical location. Define your objective first (store visits, phone calls, or bookings), pick one geometry for a test, and launch. The global geofencing market is projected to reach $11.85 billion by 2034, which tells you this is not a niche tactic. It is becoming a standard layer in local marketing.
Quick orientation:
- Channels: Programmatic in-app display, push notifications, SMS (with opt-in), and connected TV
- Pricing models: CPM (cost per thousand impressions) and CPC (cost per click) are most common
- Privacy check: U.S. campaigns must account for CCPA/CPRA consent requirements and Apple/Google app-store location rules before launch
- Starting budget: Entry-level monthly requirements on most platforms start at $500–$2,000, suitable for established local businesses.
Table of Contents
- What is geofencing advertising, and which geometry should you use?
- What use cases actually deliver results with geofencing?
- How does geofencing work under the hood?
- How to set up your first geofencing campaign, step by step
- What does geofencing advertising cost?
- How do you measure geofencing campaign performance?
- Privacy and U.S. legal considerations you cannot skip
- Common pitfalls and how to fix them fast
- How Crowdcompany runs geofencing campaigns
- Key Takeaways
- What actually separates a winning geofencing campaign from a wasted budget
- Crowdcompany runs geofencing campaigns for local businesses
- Useful sources and further reading
What is geofencing advertising, and which geometry should you use?
Geofencing advertising is distinct from broad geotargeting (city-level or DMA-level ad targeting) and from proximity marketing (which often refers to Bluetooth beacon triggers). The specific mechanism is a virtual perimeter tied to a real-world location. When a device enters, dwells in, or exits that perimeter, the platform fires a trigger and delivers an ad or notification.
The geometry you draw determines almost everything about accuracy and cost efficiency.
Radius geofences
A circle drawn from a center point outward. Fast to set up, easy to explain to a client, and available on every platform. The problem: a 300-meter radius around an urban restaurant also captures the parking garage next door, the competitor across the street, and the subway entrance. For a suburban strip mall with ample space, a 200–400 meter radius works fine. In dense urban blocks, it wastes impressions.

Isochrone geofences
An isochrone traces the area reachable within a set drive time or walk time from a point, typically 5–15 minutes. This geometry is ideal for service-area businesses (plumbers, delivery services, urgent care clinics) because it matches how customers actually think about distance. A 10-minute drive isochrone in downtown Miami covers a much smaller physical area than the same isochrone in suburban Boca Raton.

Building-footprint (polygon) geofences
Custom polygons drawn to match the exact footprint of a building or venue. Building-footprint geofences generally perform better than simple radii for visit attribution in dense environments because they eliminate the noise from adjacent parcels. If you are running a conquesting campaign against a competitor's store, a polygon drawn to that building's walls is the only geometry that reliably captures in-store visitors rather than people walking past.
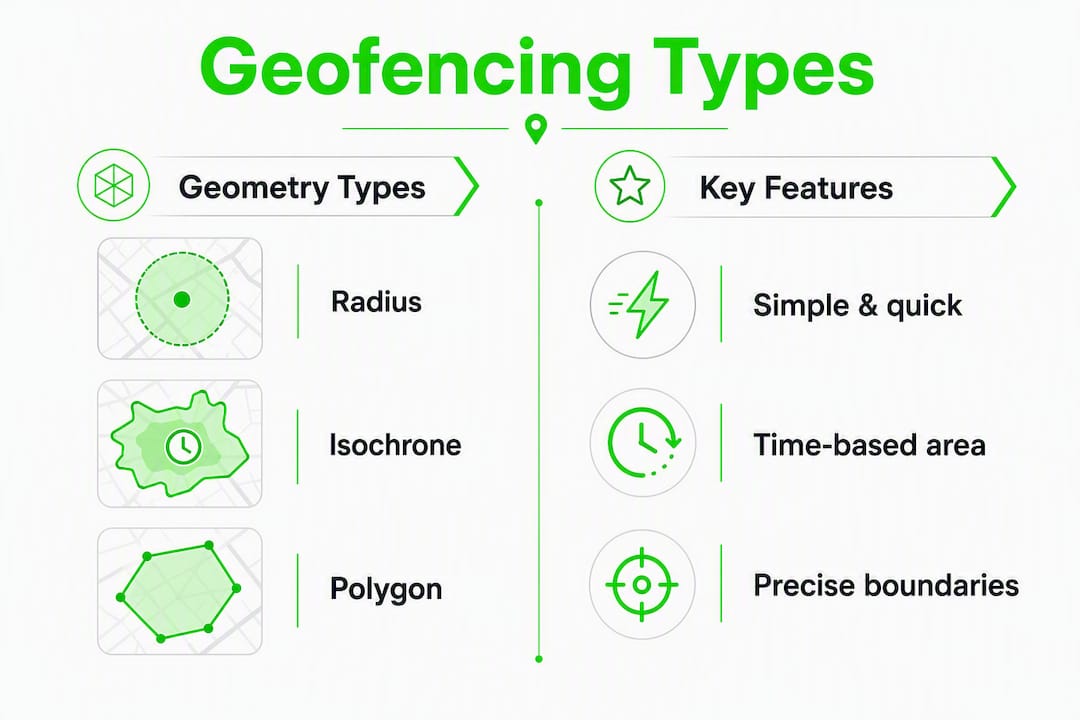
Pro Tip: Geometry choice is a primary driver of ad-spend efficiency — match the shape to the business objective, not to what the platform makes easiest. A radius is a starting point, not a default.
What use cases actually deliver results with geofencing?
Location-based marketing earns its keep when the offer matches the physical context. These are the use cases that consistently move real-world KPIs.
Conquesting. Drawing geofences around competitor locations reaches people already showing in-market intent for your category. A tire shop targeting the parking lot of a competing service center, or a fast-casual restaurant targeting the drive-through queue of a nearby chain, captures buyers who have already decided to spend. CTR on conquesting campaigns tends to run higher than standard display because the audience is self-selected.
Event targeting. A perimeter around a conference center, stadium, or festival grounds during the event window. A B2B software company targeting an industry trade show, or a sports bar targeting a stadium on game day, can reach thousands of highly relevant people in a compressed time window. The key is tight dayparting: run the fence only during event hours, not 24/7.
Store-traffic lift. Serving a discount or time-sensitive offer to people within a defined radius of your location during peak hours. A restaurant pushing a lunch special between 10:30 AM and 12:30 PM to people within a 5-minute walk is a textbook proximity advertising play. Measure success by comparing walk-in counts during campaign periods against a control baseline.
Post-visit retargeting. After a device is observed inside your geofence, you can serve follow-up ads for days or weeks afterward. A car dealership can retarget test-drive visitors with financing offers. A spa can follow up with a rebooking incentive. Lookback windows of 7–30 days are standard.
Delivery and service-area targeting. For businesses with defined service zones, an isochrone fence keeps spend inside the geography you can actually serve. A local florist, a cleaning service, or a food-delivery operation wastes money advertising to zip codes outside their delivery radius.
How does geofencing work under the hood?
Understanding the mechanics helps you evaluate vendor claims and set realistic measurement expectations.
Location data sources and accuracy
Platforms build geofencing triggers from three primary signals, and accuracy typically ranges from 20–100 meters depending on which technology is in use:
| Signal | Typical Accuracy | Best Use |
|---|---|---|
| GPS | 5–20 meters | Outdoor, open-sky environments |
| Wi-Fi triangulation | 15–40 meters | Indoor/urban; requires nearby access points |
| Cellular tower data | 50–300 meters | Rural areas; lowest precision |
For foot-traffic attribution in a dense retail environment, GPS alone is insufficient. Demand building-footprint support and documented location accuracy from your vendor if precise visit attribution is the goal.
Device matching and delivery mechanics
Programmatic geofencing works through mobile advertising IDs (IDFA on iOS, GAID on Android) collected via SDKs embedded in apps. When a device's location signal crosses your defined boundary, the platform logs the event and enters that device ID into an audience segment. Ads then serve through mobile ad networks, often within minutes of the trigger.
App-based push notifications operate differently: they require the user to have your app installed and to have granted location permission. The trigger is more precise, but the audience is far smaller.
Data-quality checklist before you buy:
- POI (point of interest) data freshness: ask when the vendor last updated building footprints
- Match rate: what percentage of observed visits are matched to a device ID and attributed
- Sample accuracy: ask if the vendor can share a walk-test or store-centroid validation methodology
- Dwell-time filtering: does the platform require a minimum dwell time (30 seconds, 2 minutes) before counting a visit?
How to set up your first geofencing campaign, step by step
Treat geofencing like a local planning exercise: test small, measure precisely, then scale only where audience density and attribution justify it.
Pre-launch: define the objective
- Set one measurable goal. Store visits, phone calls, coupon redemptions, or app installs. One metric per test.
- Establish a baseline. Pull 4–6 weeks of historical foot traffic, call volume, or conversion data before the campaign starts.
- Set a minimum test budget. You need enough impressions to reach statistical confidence. Most platforms require a minimum of 50,000–100,000 impressions to generate reliable visit-attribution data.
Geofence design workflow
- Research your audience. Where do your best customers live, work, and spend time? Location intelligence platforms use device panels and machine learning to estimate foot traffic and trade-area segmentation, which helps you draw fences where your audience actually concentrates.
- Choose geometry. Radius for simple suburban locations, polygon for dense urban or competitor conquesting, isochrone for service-area businesses.
- Draw exclusion zones. Exclude highways, parking structures, and adjacent competitor locations you do not want to capture.
Creative and offer setup
- Write proximity-aware copy. "You're 2 blocks away — lunch is on us" outperforms "Visit us today." Tie the message to time of day and distance.
- Build a dedicated landing page. Never send geofenced traffic to a homepage. A location-specific landing page with a clear offer and click-to-call button converts far better.
- Add a promo code. A unique code per campaign is the simplest form of offline attribution.
Technical setup
- Select a platform. Evaluate vendors on: polygon/building-footprint support, visit-attribution methodology, minimum spend, and reporting transparency.
- Integrate conversion tracking. Pixel on the landing page, call-tracking number, or POS coupon redemption. For deeper offline conversion tracking, tie campaign device IDs to in-store transaction data.
- Set frequency caps. 3–5 impressions per device per day is a reasonable starting point. Uncapped frequency burns budget and irritates potential customers.
Pro Tip: Use a 3-stage budget approach: allocate 60% to the test phase (weeks 1–4), 30% to the learning phase (weeks 5–8 after optimizing geometry and creative), and scale the remaining 10% into the highest-performing fence zones only after you have attribution data.
| Stage | Duration | Budget Share | Primary Goal |
|---|---|---|---|
| Test | Weeks 1–4 | 60% | Establish baseline CPV and CTR |
| Learn | Weeks 5–8 | 30% | Refine geometry, creative, dayparting |
| Scale | Week 9+ | 10% seed | Expand winning fences only |
What does geofencing advertising cost?
Geofencing advertising is priced on CPM or CPC models, with effective cost driven by geofence size, audience density, data quality, and campaign timing. Location data adds a layer on top of standard display CPMs, which is why geofencing costs more per impression than untargeted programmatic.
Primary cost drivers
- Geofence count and size: More fences and larger areas require more data processing and typically cost more per impression
- Audience density: Urban markets with high foot traffic cost more to target than rural areas with sparse device signals
- Data quality tier: Building-footprint support and verified visit attribution cost more than basic radius targeting
- Dayparting: Running ads only during peak hours reduces total spend but may increase CPM in competitive windows
- Campaign duration: Longer campaigns allow for frequency optimization; short bursts often have higher effective CPMs
Budget benchmarks
| Campaign Type | Estimated Monthly Budget | Pricing Model |
|---|---|---|
| Small local business pilot | $500–$2,000 | CPM |
| Mid-size retail or restaurant | $500–$2,000 | CPM/CPC |
| Multi-location or event campaign | — | CPM/CPC |
How much does a single geofence ad cost? On a CPM basis, location-targeted mobile display typically runs higher than standard display CPMs, with the premium reflecting the cost of location data. Entry-level monthly requirements on most platforms start at $500–$2,000, making mobile geofencing accessible to established local businesses but generally not practical for early-stage startups with minimal ad budgets.
How do you measure geofencing campaign performance?
Clicks alone are a poor proxy for geofencing success. The channel is built for real-world outcomes, so measurement needs to reach into the physical world.
Core metrics to track
| KPI | Definition | Measurement Approach |
|---|---|---|
| Impressions | Total ad views served | Platform reporting |
| CTR | Clicks ÷ impressions | Platform reporting |
| Store visits (walk-ins) | Devices observed inside the location post-exposure | Device-level visit attribution |
| Cost per visit (CPV) | Total spend ÷ attributed store visits | Platform + offline data |
| Match rate | % of observed visits matched to an exposed device | Vendor methodology doc |
| Redemption rate | Promo codes redeemed ÷ impressions | POS / CRM data |
| Incremental lift | Visit rate of exposed group vs. control group | Holdout test design |
Attribution approaches
Direct visit attribution matches device IDs that were served an ad to device IDs later observed inside the target location. The lookback window (how many days after ad exposure a visit counts) is typically 7–30 days. Shorter windows are more conservative and more defensible.
Lift testing compares a treatment group (devices that received ads) against a holdout group (similar devices that did not). This is the most rigorous method and the one worth requesting from any vendor claiming significant visit lift.
POS and CRM integration closes the loop between digital exposure and actual purchase. Offline conversion tracking that ties campaign device IDs to transaction records gives you revenue-level attribution, not just visit counts.
- Set a 4-week pre-campaign baseline for foot traffic and sales
- Define a control zone (similar location or similar audience not exposed to ads)
- Run the campaign with a consistent conversion window
- Compare visit rates and revenue between exposed and control groups
- Adjust the lookback window based on your typical purchase cycle
Privacy and U.S. legal considerations you cannot skip
Location data is among the most sensitive categories under U.S. privacy law. Getting this wrong is not just a compliance risk; it damages consumer trust.
Legal framework
The California Consumer Privacy Act (CCPA) and its amendment, the CPRA, give California residents the right to know what location data is collected, to opt out of its sale, and to request deletion. If your campaign reaches California residents (and most national campaigns do), these rules apply. Several other states, including Virginia, Colorado, and Texas, have enacted similar frameworks.
Apple's App Tracking Transparency (ATT) framework requires explicit user opt-in before an app can access the IDFA. This has materially reduced the addressable audience for app-based geofencing on iOS. Google's equivalent on Android has followed a similar direction with its Privacy Sandbox rollout.
Consent models
- App-based push notifications: Require explicit opt-in for location access at the OS level. No opt-in, no trigger.
- Programmatic display networks: Rely on aggregated and anonymized device-ID consent collected through app publishers' consent flows. Verify that your vendor's supply chain includes IAB TCF-compliant consent signals.
- First-party geofencing (your own app): Requires a clear, plain-language location permission request and a privacy notice explaining how location data is used.
Compliance checklist
- Privacy notice updated to include location data collection and use
- Opt-out mechanism accessible (in-app settings, privacy preference center, or email request)
- Data retention limits defined and enforced (most practitioners use 90–180 days for raw location logs)
- Vendor data processing agreement (DPA) in place
- Campaign data not used for re-identification of individuals
Warning: Geofencing campaigns targeting sensitive locations, including health clinics, reproductive health facilities, places of worship, addiction treatment centers, and schools, carry elevated legal and reputational risk. The FTC has taken enforcement action in this space. Consult legal counsel before drawing fences around any sensitive site category, regardless of campaign intent.
Common pitfalls and how to fix them fast
Most underperforming geofencing campaigns fail for the same handful of reasons.
The five most common mistakes:
- Oversized radii. A 1-mile radius in a city captures tens of thousands of irrelevant devices. Start tight and expand only if match rates are too low.
- Stale POI data. A building footprint from two years ago may no longer match the current tenant. Ask vendors how frequently they update location data.
- No frequency cap. Serving the same ad 20 times to the same device in a week is not retargeting; it is harassment. Cap at 3–5 impressions per device per day.
- Generic creative. A location-triggered ad that says nothing about proximity or urgency performs no better than a standard display ad.
- Measuring only clicks. A 0.3% CTR on a geofencing campaign may represent excellent performance if the store-visit rate is strong. Clicks are a secondary signal.
Five optimizations to run after the first 30 days:
- Tighten polygons to building footprints using updated POI data, then compare match rates before and after
- Add dayparting: run delivery only during hours when your audience is active, such as lunch windows, commute hours, or event schedules
- Build exclusion zones around your own location (to avoid serving ads to people already inside) and around irrelevant adjacent venues
- Sequence retargeting offers: serve a brand awareness message on day 1–3 post-visit, a specific offer on day 4–7, and a urgency message on day 8–14
- Run a polygon walk-test: physically walk the perimeter of your geofence with a test device to confirm the trigger fires where you expect it to
Pro Tip: A custom polygon aligned to a building footprint reduces wasted impressions and improves attribution accuracy compared to a simple radius. If your platform does not support polygon drawing, that is a platform limitation worth addressing before scaling spend.
How Crowdcompany runs geofencing campaigns
Crowdcompany's approach to geofencing campaigns follows a structured five-stage process designed to connect location triggers to measurable business outcomes.
Campaign process
- Measurement and optimization — Weekly reporting on CPV, match rate, and redemption rate, with geometry and dayparting adjustments in weeks 3–4.
Crowdcompany services relevant to geofencing
- Audience research and trade-area analysis
- Geofence design (polygon, isochrone, radius)
- Ad creative, video, and landing page production
- Paid advertising campaign management (Meta, Google, programmatic)
- Offline conversion tracking (scratch-off cards, NFC stands, promo codes)
- CRM integration and lead automation
- Retargeting sequence design
- Local GEO content and blog SEO to support landing page authority
Sample campaign brief template
| Element | Example |
|---|---|
| Objective | 200 incremental store visits in 30 days |
| Target geofences | 3 competitor locations + 1 event venue |
| Primary KPI | Cost per visit (target: under $12) |
| Secondary KPI | Promo code redemption rate |
| Creative assets | 3 static banners, 1 video (15 sec), 1 landing page |
| Lookback window | 14 days |
| Frequency cap | 4 impressions/device/day |
Key Takeaways
Geofencing advertising works when geometry, offer relevance, and attribution methodology are all matched to a specific business objective from day one.
| Point | Details |
|---|---|
| Start with one objective | Define a single measurable goal (visits, calls, redemptions) before drawing any fence. |
| Match geometry to goal | Use polygons for dense urban or conquesting campaigns; isochrones for service-area businesses. |
| Budget for a real test | Most platforms require $500–$2,000/month minimum; plan for a 4-week baseline before scaling. |
| Measure beyond clicks | Track store visits, cost per visit, and redemption rate — not just CTR. |
| Crowdcompany as partner | Crowdcompany handles geofence design, creative, tracking, and offline attribution for local businesses. |
What actually separates a winning geofencing campaign from a wasted budget
The conventional wisdom on geofencing says: draw a fence, run an ad, watch foot traffic rise. That framing skips the part where most campaigns quietly fail.
The real separator is almost never the platform. It is the geometry and the offer working together. A perfectly drawn polygon around a competitor's building, paired with a generic "Visit us today" banner, will underperform a slightly imprecise radius fence paired with a time-sensitive offer that speaks directly to what the person standing in that competitor's parking lot is about to spend money on. The creative has to earn the location signal.
The second thing most guides understate is the measurement problem. Vendors have a financial incentive to report high visit numbers. Match rates below 40% and dwell-time thresholds under 30 seconds are red flags that a vendor is inflating attribution. Insisting on a holdout test design, even a simple one, is the fastest way to separate real lift from noise.
For local businesses specifically, the geometry question is also a budget question. A 1-mile radius in a dense market like Miami or Boca Raton can easily capture 50,000 devices a day, most of whom have no realistic path to your location. Tightening to a 200-meter polygon and adding dayparting often cuts impressions by 70% while improving cost per visit by a similar margin. Less reach, better results.
The businesses that get the most from this channel treat it the way a good retailer treats a window display: specific, timely, and designed for someone who is already close enough to walk in.
Crowdcompany runs geofencing campaigns for local businesses
Geofencing is one of the highest-intent local channels available, but it requires precise execution to deliver a real return. Crowdcompany handles the full campaign workflow: audience research, geofence design, proximity-aware creative, landing pages, and offline conversion tracking that connects ad exposure to actual store visits and revenue.
For local businesses in South Florida and beyond, Crowdcompany builds geofencing campaigns as part of a broader local expansion strategy that ties location-based advertising to GEO content, paid media, and CRM automation. The result is a campaign where every dollar spent on location targeting is matched by a landing page, an offer, and a follow-up sequence designed to close the loop.
To get a campaign brief built for your location and objective, contact Crowdcompany here.
Useful sources and further reading
- SafeGraph: Geofencing Marketing Benefits, Costs & How to Set It Up — Best for: market size data, geometry trade-offs, pricing models, and dayparting guidance.
- GeoSpan: Geofencing for Small Business (2026) — Best for: accuracy benchmarks (20–100 meter ranges), entry-level budget expectations, and vendor evaluation criteria.
- Near-i: Geofencing for Small Business — Budget and Tips — Best for: polygon vs. radius trade-offs, test-budget methodology, and audience-density guidance.
- Placer.ai: Geofencing Marketing Complete Guide — Best for: foot-traffic lift measurement, device panel methodology, and trade-area analysis.
- Qujam: Geofencing for Small Business — Conquesting Example — Best for: conquesting campaign tactics and in-market intent targeting.
- Navigine: What Is Geofencing? Technology, How It Works & Examples — Best for: technical explanation of geofencing triggers, SDK mechanics, and industry use cases.
- Shopify: Geofencing Marketing Explained (2026) — Best for: e-commerce and retail-specific geofencing strategy and step-by-step setup.
- Salesforce: What Is Geofencing Marketing? — Best for: CRM integration context and mobile marketing framework.
- Crowdcompany: Offline Conversion Tracking for Local Businesses — Best for: connecting digital geofencing exposure to in-store transactions and POS attribution.