
The most effective audience research combines at least one behavioral data source with one stated-preference method. For statistical validity, run surveys or panels. For motivation and language, use 1:1 interviews or focus groups. For revealed behavior, pull web analytics or run A/B tests. For cultural context and message-market fit, add community mapping and social listening. Most projects need two or three of these working together.
Quick decision guide:
- Need to measure prevalence or validate a hypothesis? Surveys or panels (100+ responses minimum for small studies)
- Need to understand why people behave a certain way? 1:1 interviews or focus groups (8–12 participants per segment)
- Need to see what people actually do, not what they say? Web analytics, behavioral logs, or A/B tests
- Need to understand cultural context, trusted voices, or shared vocabulary? Community mapping and social listening
- Need all of the above for a campaign or product launch? Triangulate: qualitative discovery first, then quantitative validation, then behavioral confirmation
Start with the decision you need to make, not the method you're most comfortable with. That single shift separates research that changes strategy from research that produces a deck nobody reads.
Table of Contents
- What is audience research and how does it differ from market research?
- Qualitative vs. quantitative methods: which one does your question actually need?
- What are the core audience research methods and how do you run each one?
- How do you plan and run an audience research project from start to finish?
- What questions should you ask? A reusable question bank
- How do you turn raw research data into segments, personas, and recommendations?
- The high-impact step most teams skip: community mapping
- Ethics, consent, and U.S. data-privacy considerations
- Key Takeaways
- Why the standard approach to audience research keeps failing teams
- Crowdcompany runs audience research so your findings actually drive results
- Further reading, tools, and templates
What is audience research and how does it differ from market research?
Audience research is people-centric. It answers who your audience is, what they do, what they care about, and why they make the choices they do. Market research is landscape-centric: it answers how big a market is, who the competitors are, and whether a category is viable. Both matter, but they answer different questions, and confusing the two is one of the most common reasons research budgets get wasted.
The practical difference shows up in the deliverables. Market research produces TAM/SAM/SOM estimates, competitive landscapes, and category trend reports. Audience research produces personas, behavioral segments, journey maps, and message tests. Each of those outputs connects to a specific business decision: a persona informs creative direction, a behavioral segment informs channel mix, a message test informs copy.
Standard audience research outputs and the decisions they inform:
- Personas: creative direction, tone of voice, content topics
- Behavioral segments: channel allocation, retargeting logic, lifecycle triggers
- Journey maps: content sequencing, conversion funnel optimization
- Message tests: headline copy, value proposition framing, ad creative
- Attitudinal segments: pricing strategy, product feature prioritization
Strong audience research covers at least three of four lenses: demographic, psychographic, behavioral, and attitudinal. Koji's documentation recommends a quarterly refresh cadence for programs where audience composition or market conditions shift regularly.
Pro Tip: Before you design a single survey question or schedule a single interview, write down the specific strategic decision this research needs to inform. "Messaging A vs. B for the Q3 campaign" is a decision. "Better understand our audience" is not. The decision you define upfront determines which methods you need, how large a sample you require, and whether the results will actually get used.
Qualitative vs. quantitative methods: which one does your question actually need?
Qualitative methods (interviews, focus groups, diary studies, ethnographic observation) generate depth, language, and hypotheses. Quantitative methods (surveys, analytics, panels, A/B tests) generate prevalence, statistical comparisons, and validation. Neither is better. They answer different questions, and using only one is how teams end up either confident about the wrong things or uncertain about everything.
When qualitative is the right call
Use qualitative methods when you are in early discovery, when you need to understand the language your audience uses to describe a problem, or when you are trying to map jobs-to-be-done and motivations that a survey cannot surface. A 45-minute interview with eight people in a specific segment will tell you more about why they behave a certain way than a 500-response survey ever could. Qualitative is also the right tool for small or hard-to-reach segments where statistical sampling is impractical.

When quantitative earns its place
Quantitative methods validate, size, and compare. Once qualitative work has surfaced the hypotheses, a survey or analytics test tells you how prevalent each finding is, which segment is largest, and whether a message lifts conversion. A/B tests are the most underused quantitative tool in most marketing teams' arsenals because they measure revealed behavior rather than stated preference.
How to combine both
The most reliable workflow runs qualitative first, quantitative second. Run six to ten interviews to surface themes and language, then build a survey instrument using the exact words your audience used. Validate the themes at scale. Then use behavioral analytics to confirm that what people say they do matches what they actually do.
| Method class | Best for | Typical sample | Speed | Cost range |
|---|---|---|---|---|
| Qualitative (interviews, focus groups) | Discovery, motivation, language | 8–12 per segment | Slow (2–6 weeks) | Medium–High |
| Quantitative (surveys, panels) | Validation, prevalence, sizing | 100+ for small studies | Medium (1–3 weeks) | Low–Medium |
| Behavioral analytics | Revealed behavior, conversion patterns | All users / large samples | Fast (ongoing) | Low (tool cost) |
| Community mapping / social listening | Cultural context, trusted voices | Network-level | Medium | Medium |
Use cases where the hybrid approach pays off most:
- Product positioning: qual to find the language, quant to test which frame lifts intent
- Campaign creative: qual to identify emotional triggers, A/B test to measure lift
- Content-topic prioritization: social listening to surface demand, analytics to confirm engagement
- Pricing signals: qual to understand value perception, survey to measure willingness-to-pay distribution
What are the core audience research methods and how do you run each one?
Each method below includes what it is, when to use it, how to run it, and what it produces. These are the methods that appear consistently across practitioner guides and agency workflows.
Surveys and panels
Surveys measure prevalence and validate hypotheses across a defined population. They work best after qualitative discovery has surfaced the questions worth asking at scale. Typeform and SparkToro both note that 100+ responses is a reasonable baseline for small studies; segmentation analysis requires larger samples, typically 200–400 per segment.
How to run one:
- Define the screening criteria before you write a single question
- Keep surveys under 10 minutes; completion rates drop sharply beyond that
- Use Likert scales for attitudinal items, MaxDiff for priority ranking, and open-ended fields sparingly
- Pilot with 5–10 people before full fielding to catch confusing wording
- Tools: Typeform, SurveyMonkey, Google Forms, or Qualtrics for enterprise-grade studies
Deliverables: Prevalence data, segment profiles, message-lift scores, demographic breakdowns
1:1 interviews
Interviews are the highest-signal qualitative method. A well-run 45-minute conversation with the right person produces more usable insight than almost any other method. They are particularly effective for jobs-to-be-done research, journey mapping, and surfacing verbatim language for persona development.
How to run one:
- Recruit against a tight screener (role, behavior, recency of relevant decision)
- Pay $50–$100 for a 30-minute session to avoid biased samples skewed toward the most available people
- Use a semi-structured guide: 3–5 core topics, not a rigid script
- Record with consent and transcribe; the verbatims are the deliverable
- AI-moderated platforms can parallelize collection and output structured themes alongside raw quotes
Deliverables: Verbatim quotes, journey maps, JTBD frameworks, persona anchors
Focus groups
Focus groups surface group dynamics, shared vocabulary, and social norms around a topic. They are useful for creative testing, concept validation, and understanding how people talk about a category in a social context. They are not reliable for measuring individual attitudes because dominant voices skew the discussion.
How to run one:
- Keep groups to 6–8 participants; larger groups fragment
- Use a trained moderator; the facilitator's neutrality determines data quality
- Separate groups by segment to avoid cross-contamination of perspectives
- Record and observe from outside the room when possible
Deliverables: Shared vocabulary, concept reactions, creative feedback, social norms
Social listening and review analysis
Social listening captures what your audience says when they are not talking to you. Reviews, forum threads, social posts, and comment sections contain unfiltered language, recurring complaints, and aspirational framing that surveys rarely surface. Combining social listening with owned data (CRM records, web analytics) produces segments that are both culturally grounded and behaviorally validated.
Tools: Brandwatch, Sprout Social, Mention, or native platform analytics for smaller budgets. For review analysis, Google Reviews, Yelp, and Amazon reviews are free and underused primary sources.
Deliverables: Recurring language themes, unmet needs, competitor sentiment, cultural references
Web and behavioral analytics
Analytics tells you what people do, not what they say. Page-level engagement, scroll depth, click paths, conversion funnels, and session recordings reveal behavior that self-report methods systematically miss. This is the fastest and cheapest method to add to any research mix.

Tools: Google Analytics 4, Hotjar, Microsoft Clarity (free), Mixpanel for product analytics
Deliverables: Funnel drop-off points, high-engagement content, segment behavior patterns, A/B test results
Observational and ethnographic methods
Watching people interact with a product, a space, or a piece of content in real time surfaces behaviors that participants cannot articulate in an interview. For cultural-sector researchers, in-person observation at events, galleries, or retail environments is often the most direct path to understanding how audiences actually engage.
How to run one:
- Define specific behaviors to observe before the session
- Use a structured observation log (behavior, context, frequency)
- Combine with brief conversational interviews immediately after observation
- Digital equivalent: session recordings and heatmaps via Hotjar or Microsoft Clarity
Deliverables: Behavioral patterns, usability findings, environmental context, friction points
Competitor and industry research
Analyzing competitor messaging, positioning, and audience signals tells you what is already working in your category and where the gaps are. This is desk research, not primary research, but it sets the baseline for everything else.
How to run it:
- Audit competitor websites, ad libraries (Meta Ad Library, Google Ads Transparency Center), and review profiles
- Note the language they use, the audiences they target, and the claims they make
- Identify positioning gaps your audience research can validate
Deliverables: Competitive positioning map, messaging gap analysis, category vocabulary
Pros/cons comparison across methods:
| Method | Validity | Speed | Cost | Best signal |
|---|---|---|---|---|
| Surveys | High (at scale) | Medium | Low–Medium | Prevalence, validation |
| 1:1 interviews | High (depth) | Slow | Medium–High | Motivation, language |
| Focus groups | Medium | Medium | Medium | Social norms, creative |
| Social listening | Medium | Fast | Low–Medium | Unfiltered language |
| Behavioral analytics | High (behavior) | Fast | Low | Revealed behavior |
| Observation / ethnography | High (context) | Slow | Medium | In-context behavior |
| Competitor research | Low (indirect) | Fast | Low | Category gaps |
Pro Tip: Recruit 8–12 participants per meaningful segment for qualitative work, not one large convenience sample. A single loud subgroup will dominate your findings if you pool everyone together. Segment first, then recruit to each bucket.
How do you plan and run an audience research project from start to finish?
Six steps cover the full arc from question to deliverable. The timeline and cost vary by project scale, but the sequence is consistent.
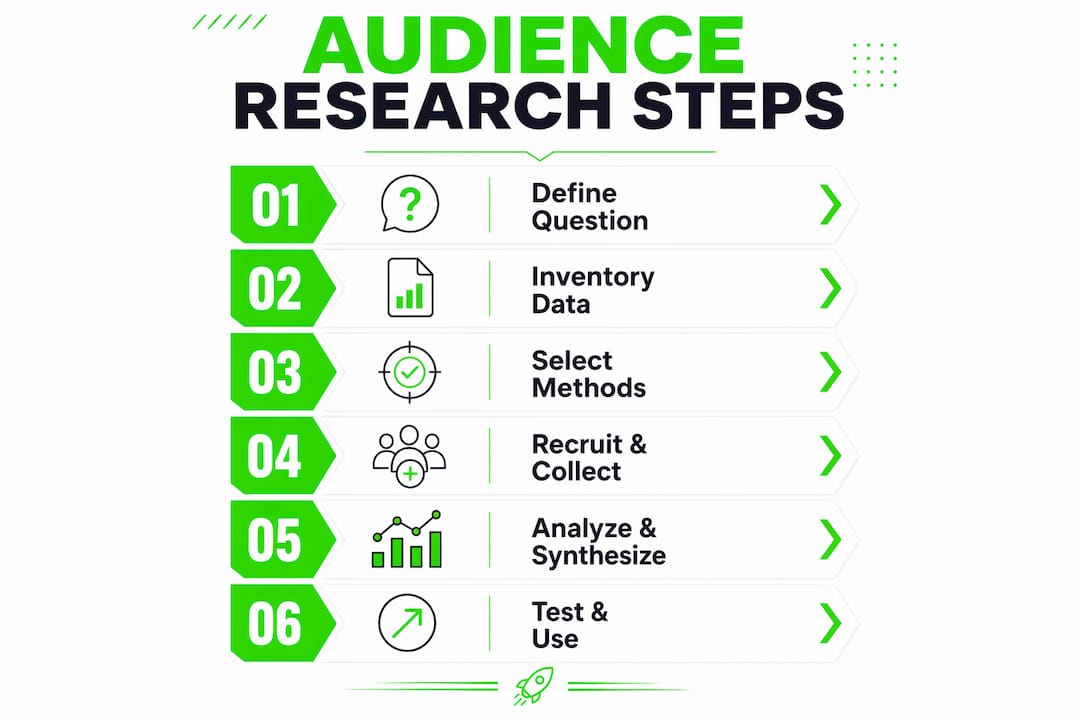
Step 1: Define the decision and scope. Write the strategic decision in one sentence. Identify who needs to make it, when, and what they will do differently based on the findings. This step takes one meeting and prevents weeks of wasted fieldwork.
Step 2: Inventory existing data. Before spending on new research, audit what you already have: CRM data, web analytics, past survey results, customer service logs, social listening reports. Most teams have more usable data than they realize.
Step 3: Choose methods. Match methods to the question type using the decision guide at the top of this article. Define sample quotas, screening criteria, and deliverable formats before recruiting begins.
Step 4: Recruit and collect. Recruit against the screener, not convenience. Pay appropriate incentives. Field in parallel where possible to compress timelines.
Step 5: Analyze and synthesize. Triangulate qualitative themes with quantitative prevalence and behavioral signals. Build segments, personas, and message frameworks from the combined data.
Step 6: Test and operationalize. Turn findings into testable hypotheses. Run A/B tests on messaging. Build segments into your CRM and retargeting programs. Track outcome metrics after implementation.
Timeline and cost estimates by project type
| Project type | Timeline | DIY cost | Panel-based cost | Agency-run cost |
|---|---|---|---|---|
| Rapid (single method, small n) | Under 2 weeks | $0–$500 | $500–$2,000 | $2,000–$5,000 |
| Small (2–3 methods, 1–2 segments) | 2–6 weeks | $500–$2,000 | $2,000–$8,000 | $5,000–$15,000 |
| Medium (mixed methods, 3+ segments) | 6–12 weeks | $2,000–$5,000 | $8,000–$25,000 | $15,000–$50,000 |
Planning checklist:
- Research objective written as a single decision statement
- Audience eligibility criteria and screening logic defined
- Sample quotas set per segment
- Deliverable formats agreed with stakeholders before fieldwork begins
- Reporting cadence and owner assigned
- Incentive budget approved and tax-reporting thresholds noted (see ethics section)
Metric templates to track research quality:
- Survey response rate and completion rate (flag if completion drops below 70%)
- Representativeness check against known population benchmarks
- Margin of error for survey findings (report at 95% confidence)
Outcome metrics to track after implementation:
- Click-through rate lift on tested messaging
- Conversion rate delta on landing pages informed by research
- Retention or repeat-purchase rate change in targeted segments
For panel procurement and tool selection, platforms like Typeform (surveys), Respondent.io (recruitment), and Brandwatch (social listening) cover most small-to-medium project needs without enterprise contracts.
What questions should you ask? A reusable question bank
Every question block should serve one objective. Mixing demographic, behavioral, and attitudinal questions in the same block produces muddled data and confused respondents. Structure your instrument in clear sections, each with a single purpose.
Survey instrument structure
Screening questions (gate respondents before they enter the full survey):
- What is your current role? (Select one: [role list])
- How recently have you [relevant behavior]? (Within the last 30 days / 3 months / 6 months / more than 6 months / never)
- Do you currently [qualifying condition]? (Yes / No — terminate if No)
Demographics and firmographics:
- What is your age range?
- What industry do you work in?
- How large is your organization? (For B2B)
- What is your approximate household income? (For B2C, optional)
Behavioral frequency items:
- How often do you [specific behavior]? (Daily / Weekly / Monthly / Rarely / Never)
- Which of the following have you done in the past 90 days? (Select all that apply)
- Where do you typically go first when you need [category solution]?
Attitudinal Likert scales (1–5 or 1–7, labeled anchors):
- "I feel confident that I can [relevant task]." (Strongly disagree → Strongly agree)
- "The biggest barrier to [outcome] for me is [X]." (Rate agreement)
- "I would recommend [category/product] to a colleague." (NPS variant)
MaxDiff / priority ranking:
- Of the following features, which is MOST important and which is LEAST important to you? (Rotate sets of 4–5 attributes)
Willingness-to-pay probe:
- At what monthly price would [solution] feel like a good value?
- At what price would it feel too expensive to consider?
Interview script structure
Opening (2 minutes): Introduce the session, confirm recording consent, explain there are no right or wrong answers.
Warm-up (5 minutes):
- "Tell me a bit about your role and what a typical week looks like for you."
- "How long have you been working in [relevant area]?"
Deep-dive probes (30–35 minutes):
- "Walk me through the last time you had to [relevant decision or task]. What triggered it?"
- "What did you try first? What happened?"
- "What would have made that easier?"
- "When you describe this problem to a colleague, what words do you use?"
- "What would have to be true for you to [desired behavior]?"
Closing (5 minutes):
- "Is there anything about this topic we haven't covered that you think is important?"
- "If you were advising someone in your position, what would you tell them?"
Pro Tip: The closing question "what words do you use when you describe this to a colleague?" is the single most valuable question in any interview script. The verbatim answer is your persona language, your ad copy, and your SEO keyword research rolled into one.
User-test prompts
- "Without clicking anything yet, tell me what you think this page is for."
- "Show me how you would [specific task]. Talk out loud as you go."
- "You've just landed on this page from a search. What do you do next?"
Piloting question wording: Run every new instrument with 5–10 people before full fielding. Ask them to flag any question that confused them or felt ambiguous. Rewrite before you scale.
How do you turn raw research data into segments, personas, and recommendations?
Triangulate qualitative themes with quantitative prevalence and behavioral signals to form segments. That sentence describes the entire synthesis process. Everything else is execution detail.
Segmentation approaches
Rule-based cutting divides the audience by one or two observable variables (industry + company size, or behavior frequency + channel preference). Fast, transparent, and easy to operationalize in a CRM. Use it when the decision is simple and the segments are clearly distinct.
Cluster analysis groups respondents by similarity across multiple variables simultaneously. More statistically rigorous, but requires a larger sample (typically 200+ per segment) and a data analyst. Use it when you suspect the audience is more complex than any single variable reveals.
Value-based segmentation groups by revenue potential, lifetime value, or strategic importance rather than demographics or behavior. Use it when the business question is about resource allocation rather than messaging.
Persona template
A complete persona includes: name and archetype label, demographic profile, primary job-to-be-done, top three motivations, top three barriers, preferred channels, and at least one verbatim quote from a real interview. That last field is not optional.
"I don't need another dashboard. I need someone to tell me which three things to fix this week and why they matter." — Operations manager, mid-size B2B firm, 1:1 interview
A persona without a verbatim quote is likely fiction. The quote is what keeps the persona grounded in real language rather than researcher assumptions.
Prioritization matrix for recommended actions
Score each recommended action on two dimensions: estimated reach (how many people in the audience it affects) and estimated affinity (how strongly it aligns with a documented audience motivation). High reach and high affinity go first. Low reach and low affinity get cut.
| Recommendation | Reach | Affinity | Priority |
|---|---|---|---|
| Reframe homepage headline around JTBD language | High | High | Immediate |
| Add case study content for segment B | Medium | High | Next sprint |
| Build retargeting segment from behavioral data | High | Medium | Next sprint |
| Redesign pricing page layout | Low | Medium | Backlog |
Reporting best practices: Deliver an executive one-pager (decision, method, top three findings, recommended actions) alongside a full appendix with raw data tables, crosstabs, and interview transcripts. For teams with analytical capacity, reproducible analysis notebooks (Python or R) make it easy to rerun the analysis when new data arrives.
The high-impact step most teams skip: community mapping
Most audience research stops at demographics and stated preferences. Community mapping goes one layer deeper by asking: who do these people follow, what vocabulary do they share, and who do they trust to recommend things to them? Community membership predicts behavior more reliably than demographic similarity, and skipping this step is the most common gap in modern audience analysis.
Why it matters: Pulsar identifies community mapping as the most commonly skipped but highest-impact step in audience analysis. Two people with identical demographics who belong to different communities will respond to the same message in completely different ways.
What community mapping reveals
A demographic profile tells you someone is a 35-year-old urban professional. A community map tells you they follow a specific set of creators, use a particular vocabulary to describe their problems, and trust recommendations from a narrow set of media outlets. That second layer is what determines whether your message lands or gets ignored.
How to run community mapping
- Define the seed audience. Start with your existing customers, followers, or a defined prospect list.
- Map the follow graph. Identify which accounts, creators, and publications your seed audience follows disproportionately compared to the general population.
- Extract shared vocabulary. Analyze the language used in posts, comments, and bios within the community. Note recurring phrases, hashtags, and references.
- Identify trusted creators and distribution partners. The accounts with the highest concentration of your audience are your most efficient distribution channels.
- Name the communities. Group clusters by shared vocabulary and cultural references, not just demographics. A cluster that follows sustainability-focused creators and uses specific terminology is a distinct community even if their demographics overlap with another group.
- Produce a community brief. Document community names, cultural references, trusted creators, and recommended distribution partners for each segment.
Tools for community mapping: Pulsar, SparkToro, and Audiense are purpose-built for this. For smaller budgets, manual analysis of follower overlap using native platform analytics and audience intelligence tools can approximate the same output.
For cultural-sector researchers specifically, community mapping is often more predictive than any survey because cultural consumption is driven by identity and community membership, not just stated preferences. A museum, festival, or media brand that maps its communities before a campaign launch will consistently outperform one that relies on demographic targeting alone.
Ethics, consent, and U.S. data-privacy considerations
Always get informed consent, minimize personal data collection, and store data according to a documented retention policy. Those three principles cover the majority of ethical and legal risk in audience research.
Practical checklist:
- Consent language must clearly state what data is being collected, how it will be used, and who will have access to it
- Never collect sensitive data (health, political affiliation, religion, financial details) unless it is directly necessary for the research objective
- Provide a genuine opt-out mechanism before and during data collection
- Store personally identifiable information (PII) separately from response data; de-identify datasets before sharing with stakeholders or external partners
- Set a data retention period (90 days is common for primary research data) and document it
- For California residents: the California Consumer Privacy Act (CCPA) gives consumers the right to know what personal data is collected, the right to delete it, and the right to opt out of its sale. If your research involves California residents, your consent language and data handling must reflect these rights
- For research involving minors (under 18): obtain written parental consent before any data collection, regardless of the research method
- Incentive payments of $600 or more to a single participant in a calendar year may require a 1099-NEC filing under IRS rules. Track cumulative incentive payments per participant
Pro Tip: Document your consent process and keep a short audit trail: the consent form version used, the date fielding began, and the data storage location. A one-page research ethics log takes 15 minutes to create and protects you if a stakeholder or legal team asks questions six months later.
Key Takeaways
The most effective audience research combines behavioral data, stated-preference methods, and community mapping to produce segments and personas that actually change how teams make decisions.
| Point | Details |
|---|---|
| Start with the decision | Define the specific strategic decision before choosing any method; research without a decision produces observations, not strategy. |
| Mix methods deliberately | Pair at least one behavioral source (analytics or social listening) with one stated-preference method (survey or interviews) on every project. |
| Recruit and incentivize properly | Pay $50–$100 for 30-minute interviews and recruit 8–12 participants per segment to avoid biased samples. |
| Add community mapping | Map follow graphs and shared vocabulary when message-market fit matters; community membership predicts behavior better than demographics alone. |
| Crowdcompany executes the full mix | Crowdcompany runs audience research and targeting, community engagement, and segment-to-channel operationalization for local businesses and brands. |
Why the standard approach to audience research keeps failing teams
Most audience research projects fail not because the methods are wrong but because the question was never properly defined. Teams commission a survey, get 400 responses, produce a persona deck, and then watch it sit unused because nobody agreed upfront on what decision it was supposed to inform.
The second failure mode is method monoculture. A team that only runs surveys will consistently miss the motivational depth that interviews surface. A team that only does interviews will mistake a vivid anecdote for a universal truth. The triangulation principle, combining qualitative depth with quantitative prevalence and behavioral confirmation, is not a methodological nicety. It is the difference between research that gets implemented and research that gets filed.
Community mapping is where the real gap shows up for cultural-sector and brand teams. Demographic targeting is table stakes. Every agency and in-house team does it. What most skip is the layer underneath: the shared vocabulary, the trusted creators, the cultural references that define how a community actually processes a message. Two people with identical demographics who belong to different communities will respond to the same ad in completely different ways. Ignoring that layer is not a minor oversight.
The teams that get the most from audience research treat it as an ongoing operational practice, not a one-time project. Quarterly refreshes, continuous social listening, and a living persona library that gets updated with new verbatims after every campaign cycle. That cadence is what separates organizations that genuinely know their audiences from those that think they do.
Crowdcompany runs audience research so your findings actually drive results
Running a research project end-to-end, from screener design to persona delivery, takes time most marketing teams do not have. Crowdcompany handles the full process: research plan, participant recruitment, survey fielding and interview moderation, synthesis into segments and personas, message testing, and a distribution plan that connects findings directly to paid advertising campaigns and digital PR execution.
The deliverables are concrete: a research brief, a segmentation model, named personas with verbatim quotes, a message-test report, and a channel plan built around the communities your audience actually belongs to. No generic decks. No findings that sit in a folder.
Crowdcompany is rated the #1 marketing agency in Boca Raton and works with local businesses, restaurants, and e-commerce brands that need research-backed growth, not guesswork. If you are ready to run audience research that feeds directly into your next campaign, get in touch with Crowdcompany to scope a project.
Further reading, tools, and templates
Audience intelligence and community mapping platforms:
- Pulsar for community mapping, social listening, and audience analysis
- SparkToro for audience research and channel discovery
- Audiense for Twitter/X-based community segmentation
Survey and panel tools:
- Typeform, SurveyMonkey, and Qualtrics for survey fielding
- Respondent.io and UserInterviews.com for participant recruitment
- Google Forms for zero-budget pilots
Behavioral analytics tools:
- Google Analytics 4 for web behavior
- Hotjar and Microsoft Clarity (free) for session recordings and heatmaps
- Mixpanel for product and event analytics
Templates and frameworks:
- IMS step-by-step audience research guide for publishers and editorial teams
- Typeform's target market guide for survey design and sample-size guidance
Crowdcompany service pages aligned to research methods:
- Audience research and targeting for managed research and segmentation
- Community engagement for community mapping and creator outreach
- Retargeting and email marketing for operationalizing segments into lifecycle programs
For teams running research that feeds into physical promotional campaigns, understanding how research findings translate into promotional product selection is a practical downstream consideration worth reviewing before finalizing a distribution plan.